Optimize Grow Empower

RCM Insights
< All Work | Healthcare
Data Insights
Data Insights and Visuals
Case Study: Data Analytics & Visualization for Revenue Cycle Management (RCM) Company
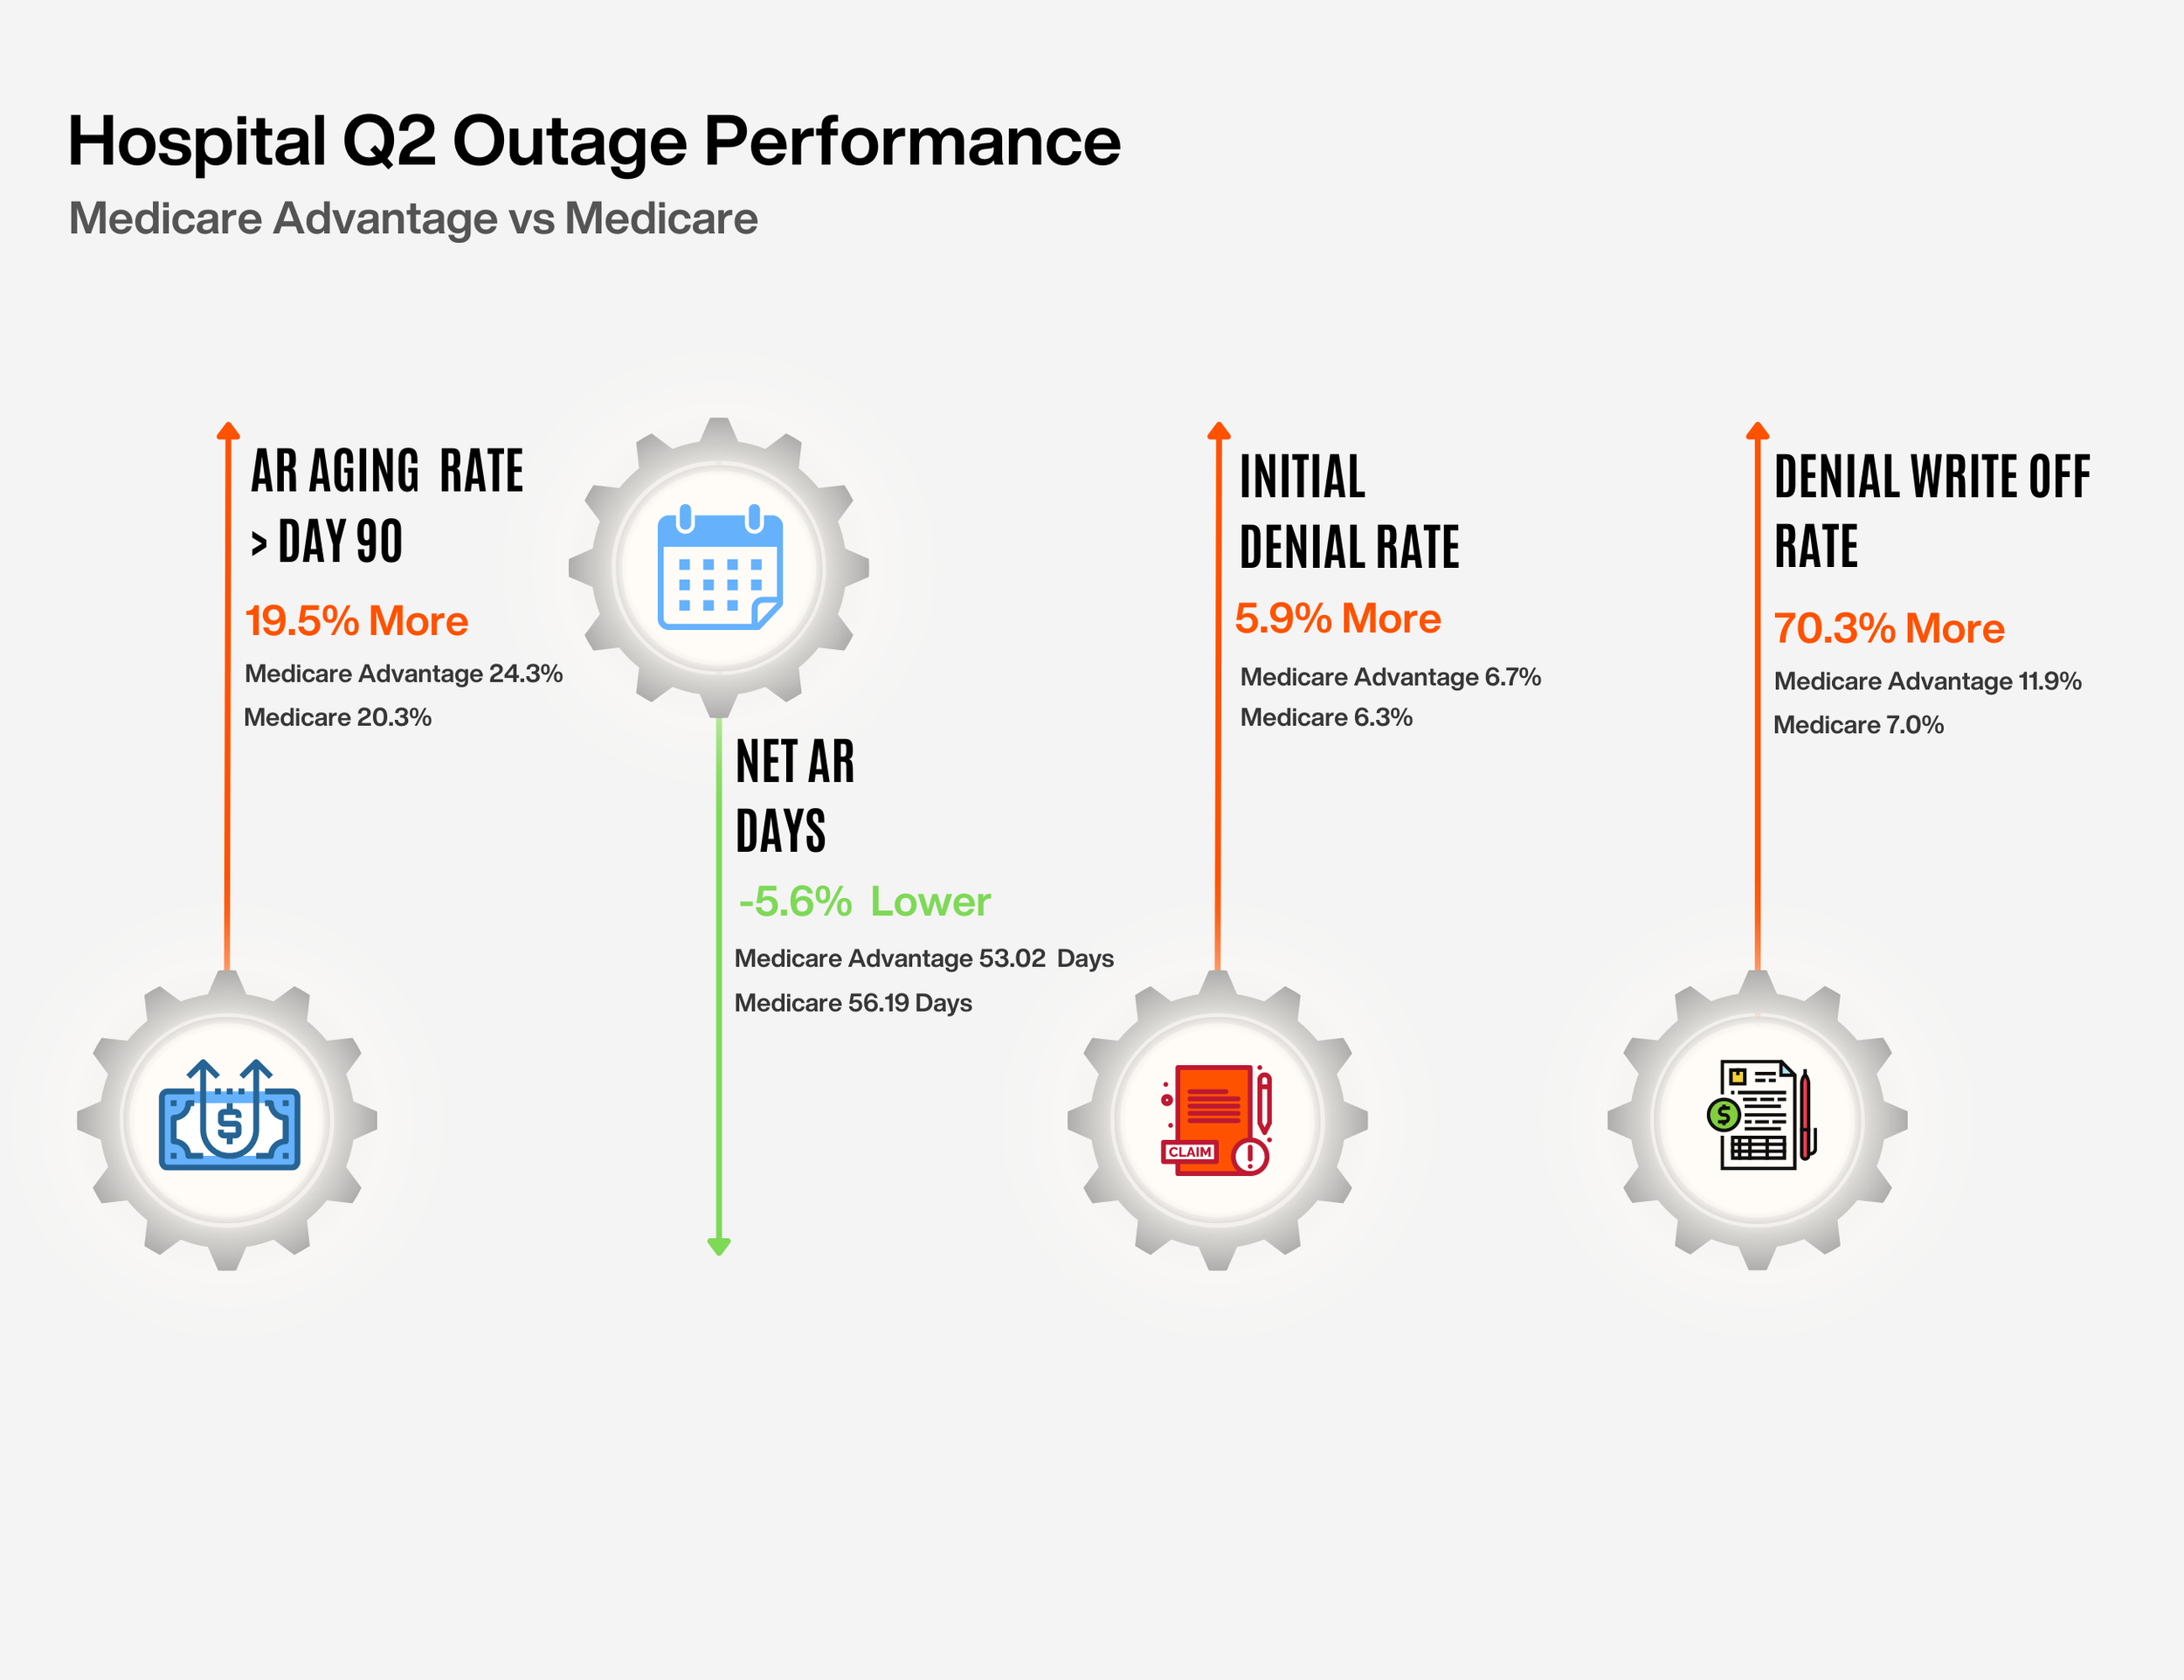
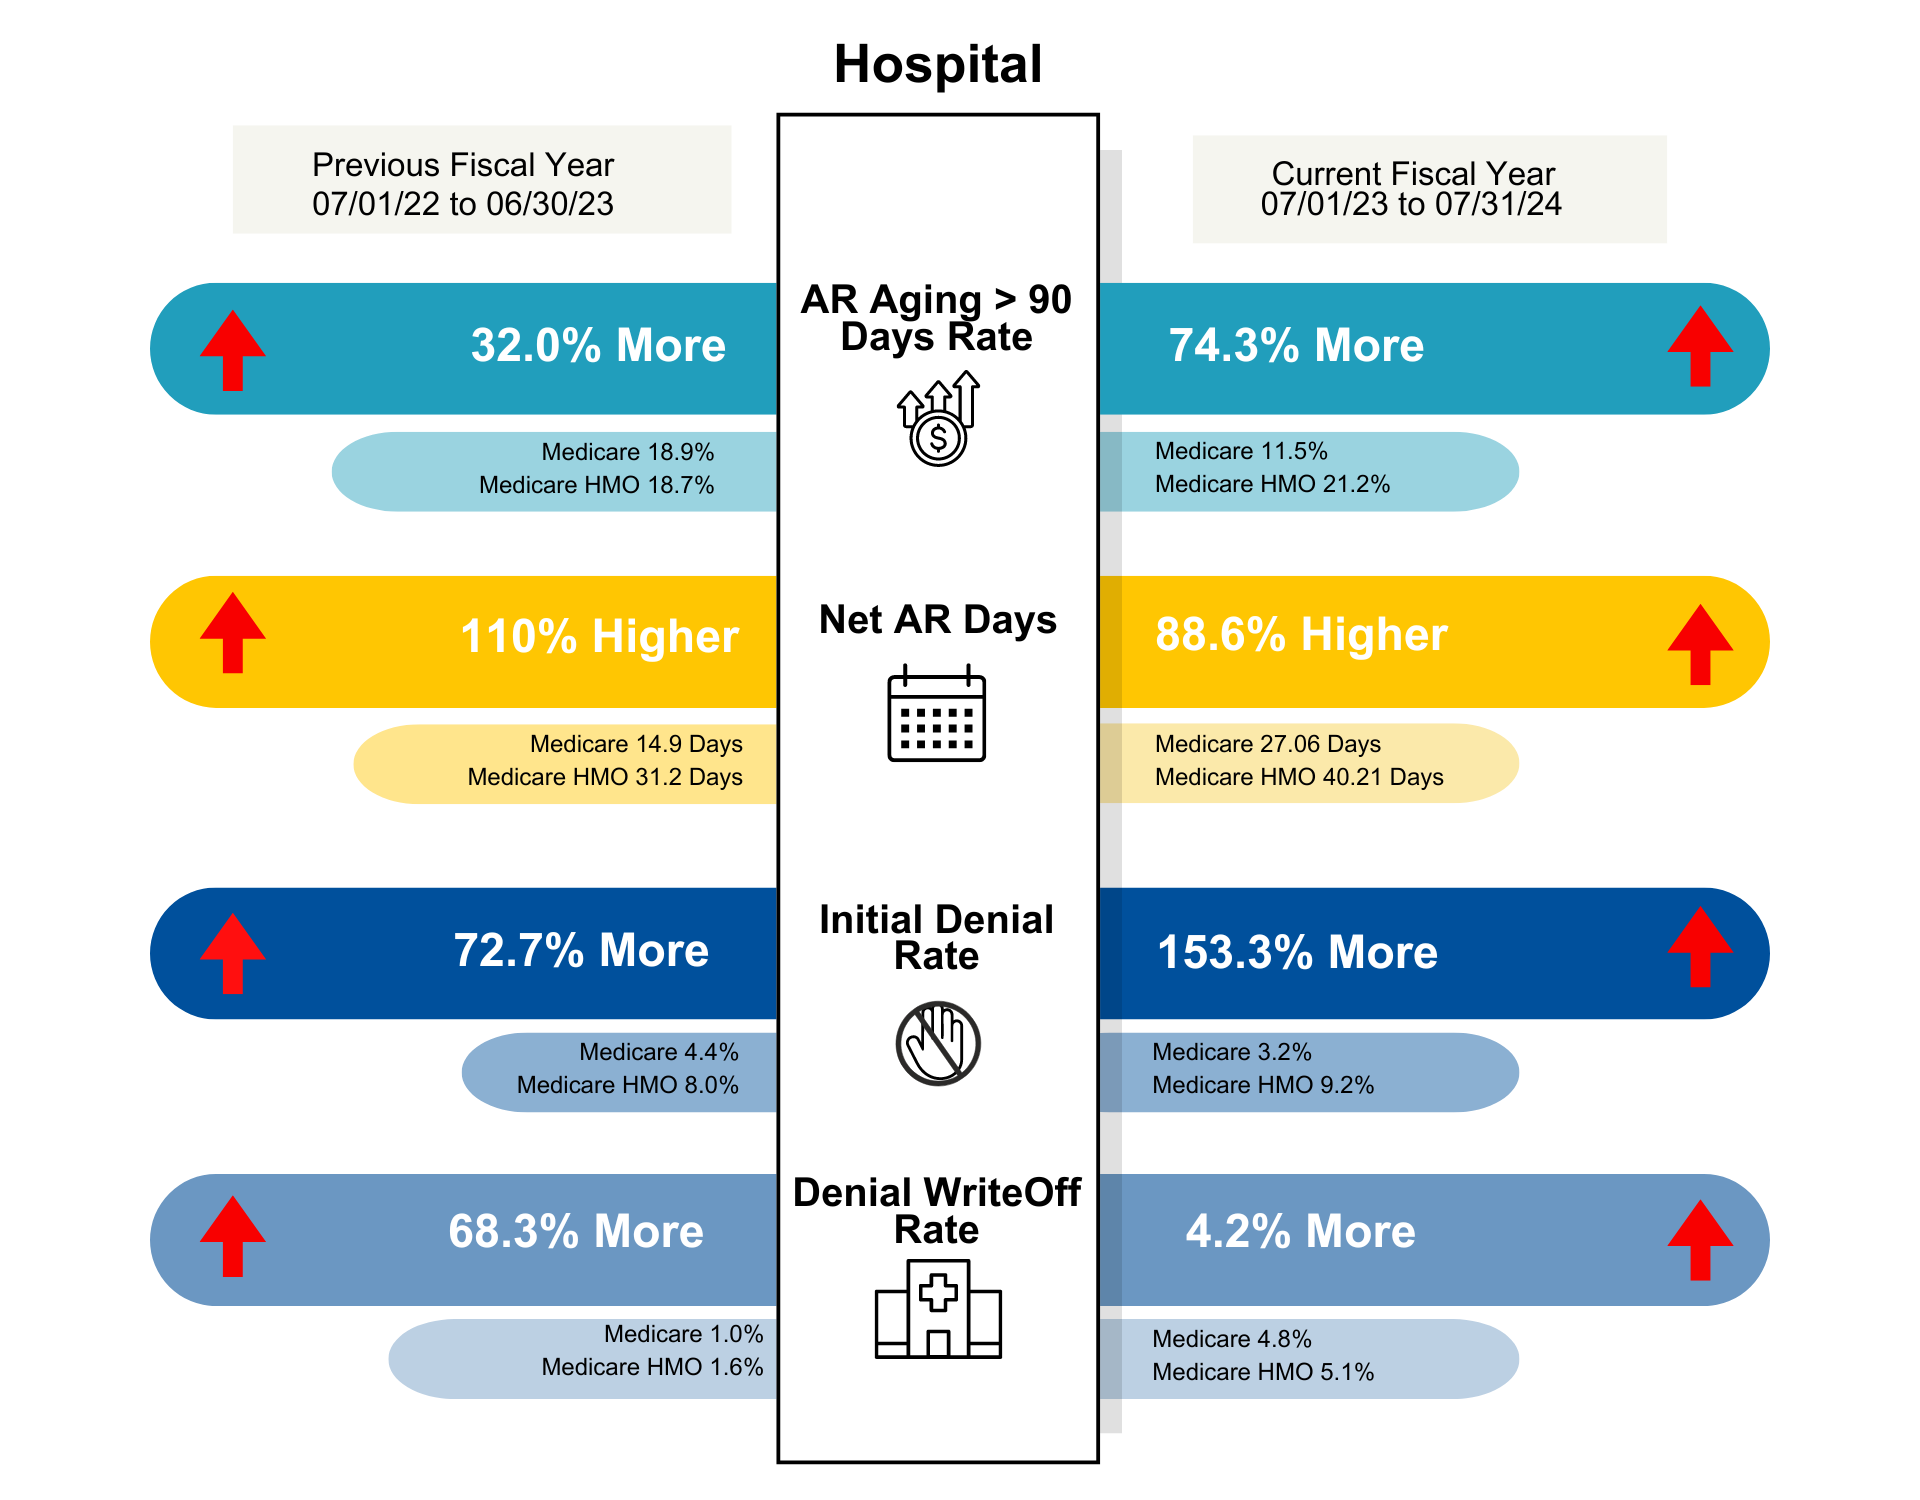
Project Overview: End-to-end Revenue Cycle Management (RCM) company to provide comprehensive data analytics and compelling visualizations to enhance their business operations and marketing strategies. Our objective was to deliver clear, actionable insights through data visualization that could be leveraged at both the executive level and in client reporting.
Visual 1: C-Suite Marketing Tool The first visualization, was developed specifically for the C-suite to utilize in their marketing efforts. This infographic focused on key metrics comparing Medicare Advantage vs. Medicare performance, such as AR aging, denial rates, and write-off rates. The clean, impactful design highlighted the differences in performance, helping the company effectively communicate their value proposition to potential clients and stakeholders.
Visual 2: Client Reporting The second visualization was crafted for internal client reporting purposes. This graphic provided a detailed performance comparison between two fiscal years, focusing on metrics such as AR aging over 90 days, Net AR Days, initial denial rates, and denial write-off rates. The clear presentation of year-over-year changes gave clients a transparent view of their financial performance and helped facilitate data-driven conversations between the company and its clients.
Confidentiality Note: All data presented in these visuals has been de-identified and intentionally modified for privacy and confidentiality purposes. No real client data is displayed in these samples.


